
Your Personality Snapshot
Jim and Carol are “porch people.” You picture slow mornings with coffee, a garden that gets a little bigger every year, and a guest room that is always ready for the grandkids. Neither of you wants the noise of a big downtown, but you both want a real city within 20 minutes for church, concerts and a good restaurant on Friday night.
Where you differ is climate: Carol wants warmth and sunshine, Jim wants to feel the seasons change. You meet in the middle on places with short, mild winters and long springs. You agree strongly on community — living among neighbors who share your culture and history ranked as “very important” for both of you — and on staying close to excellent healthcare as you plan for the decades ahead.
Your shared style is practical and generous: a single-level home with room to host, a budget that leaves space for travel, and a town that feels like it will welcome you for good.
Your AI Home Vision
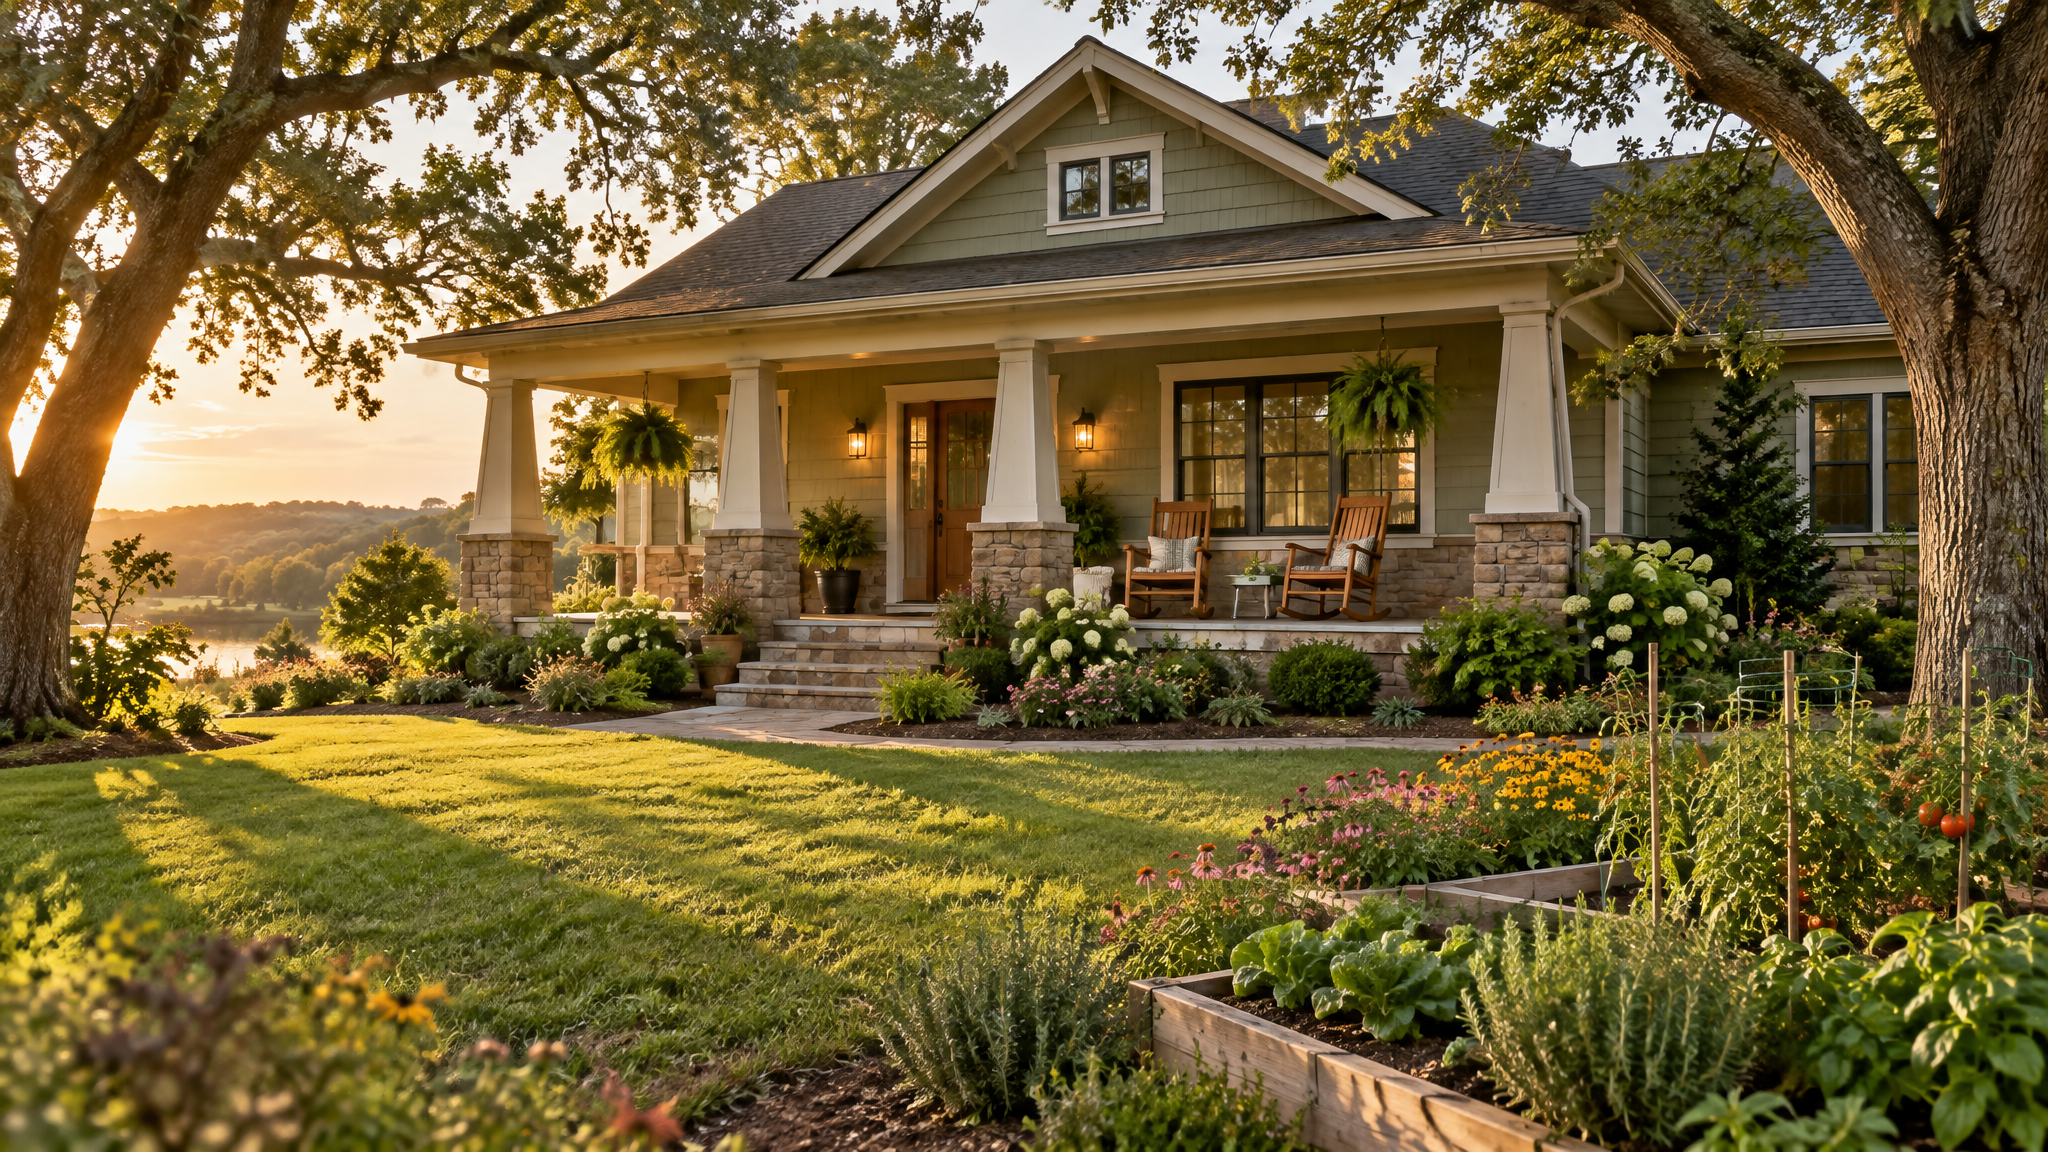 Computer-generated image
A single-level craftsman with a deep front porch, a guest suite for the grandkids and room for Carol’s garden — imagined for Raleigh, NC.
Computer-generated image: an AI representation of the kind of home and area you might find in Raleigh, NC. It is not an actual home, listing, or location.
#1 couple match
Raleigh, NC
91%
match
Part of the Research Triangle, offering excellent healthcare, top universities, and a growing cultural scene.
- Four-season climate with mild winters you both asked for
- Median home price inside your shared budget
- Thriving Black professional community and two HBCUs nearby
- Top-rated hospitals within a short drive
Median home
$400,000
Cost of living
101 (U.S. = 100)
Climate
Mild & temperate · 42°/79°F
Demographics (Census ACS)
Population (2024)
481,031
Growth since 2019
+3.6%
Median age
34.7
Residents 65+
12.1%
Median household income
$85,395
Income growth since 2019
+27.0%
Black household income
$57,849
Home ownership
50.7%
Poverty rate
11.9%
Poverty rate, 65+
9.5%
Race & ethnicity: Black 26.0% · White 51.1% · Hispanic 12.6% · Asian 5.2% · Other 5.1%
Crime (per 100,000 residents, 2025)
Violent crime
395 · 20% above the national average
Property crime
2,305 · 49% above the national average
Source: FBI Crime Data Explorer, Raleigh Police Department. State average: violent 334, property 1,815.
Taxes
- Property tax
- 0.78%
- State income tax (top)
- 4.25%
- Social Security
- Not taxed
- Pensions
- Partly exempt
- Sales tax (state + avg. local)
- 7.00%
FEMA natural hazard risk
Relatively High · county score 96/100
Top hazards: Hail, Riverine flooding, Heat wave
Nearest major airport
11 mi to Raleigh-Durham International Airport (RDU)
#2 couple match
Charleston, SC
87%
match
A historic coastal gem with rich Gullah culture, world-class dining, and beautiful architecture.
- Warm coastal climate Carol ranked first
- Walkable historic downtown and great dining
- Rich Gullah Geechee heritage and cultural events
- No tax on Social Security benefits
Median home
$420,000
Cost of living
108 (U.S. = 100)
Climate
Humid subtropical · 51°/82°F
Demographics (Census ACS)
Population (2024)
154,338
Growth since 2019
+14.1%
Median age
36.6
Residents 65+
16.6%
Median household income
$92,414
Income growth since 2019
+35.0%
Black household income
$45,147
Home ownership
55.6%
Poverty rate
12.3%
Poverty rate, 65+
7.5%
Race & ethnicity: Black 15.8% · White 71.7% · Hispanic 6.1% · Asian 1.9% · Other 4.5%
Crime (per 100,000 residents, 2025)
Violent crime
281 · 15% below the national average
Property crime
1,613 · about the national average
Source: FBI Crime Data Explorer, Charleston Police Department. State average: violent 390, property 1,717.
Taxes
- Property tax
- 0.57%
- State income tax (top)
- 6.2%
- Social Security
- Not taxed
- Pensions
- Partly exempt
- Sales tax (state + avg. local)
- 7.50%
FEMA natural hazard risk
Relatively High · county score 99/100
Top hazards: Coastal flooding, Hurricane, Earthquake
Nearest major airport
9 mi to Charleston International Airport (CHS)
#3 couple match
Atlanta, GA
84%
match
A vibrant cultural capital of the South with deep African American heritage, world-class dining, and a booming economy.
- Largest airport hub in the country for visiting the grandkids
- Deep cultural institutions and HBCU community
- Wide range of suburbs within budget
- World-class healthcare systems
Median home
$380,000
Cost of living
103 (U.S. = 100)
Climate
Humid subtropical · 44°/80°F
Demographics (Census ACS)
Population (2024)
505,268
Growth since 2019
+3.4%
Median age
34.2
Residents 65+
12.7%
Median household income
$85,652
Income growth since 2019
+42.9%
Black household income
$51,197
Home ownership
46.4%
Poverty rate
16.9%
Poverty rate, 65+
19.3%
Race & ethnicity: Black 45.4% · White 38.1% · Hispanic 6.3% · Asian 5.2% · Other 5.0%
Crime (per 100,000 residents, 2025)
Violent crime
736 · 123% above the national average
Property crime
3,119 · 101% above the national average
Source: FBI Crime Data Explorer, Atlanta Police Department. State average: violent 304, property 1,412.
Taxes
- Property tax
- 0.91%
- State income tax (top)
- 5.39%
- Social Security
- Not taxed
- Pensions
- Partly exempt
- Sales tax (state + avg. local)
- 7.38%
FEMA natural hazard risk
Relatively High · county score 96/100
Top hazards: Lightning, Riverine flooding, Tornado
Nearest major airport
8 mi to Hartsfield Jackson Atlanta International Airport (ATL)
Your Cities Ranked by Lowest Crime
Violent and property crimes per 100,000 residents, from the FBI Crime Data Explorer. U.S. average: violent 330, property 1,552.
| Rank | City | Violent | Property | Year |
|---|---|---|---|---|
| 1 | Charleston, SC | 281 | 1,613 | 2025 |
| 2 | Raleigh, NC | 395 | 2,305 | 2025 |
| 3 | Atlanta, GA | 736 | 3,119 | 2025 |
Sources & Links Used in This Report
- U.S. Census Bureau — American Community Survey (5-year estimates) — Population, age, income, race & ethnicity, home ownership, poverty
- Data USA (Census ACS data access) — City and state demographic figures (2019 and 2024)
- Data USA API — Retrieval of the ACS demographic tables
- Census Gazetteer place files — Matching each city to its Census place
- FBI Crime Data Explorer (UCR) — Violent and property crime rates per 100,000 residents
- MIT Election Data + Science Lab — County-level presidential vote shares (political filter)
- AARP — Retiree relocation trends
- HireAHelper — Migration and moving trends
- LendingTree — Home insurance and cost trends
- CNBC — Retirement and housing market news
- HouseCanary — Home price outlook
- Realtor.com Research — Housing market data and home search links
- Brookings Institution — Black migration and regional trends
- Pew Research Center — Demographic and migration research
- Zippopotam.us — ZIP code location lookup
- FEMA National Risk Index (county level) — Natural hazard risk score, rating and top hazards per county
- Tax Foundation — State income tax rates, combined state + local sales tax, retirement income taxation
- OurAirports — Nearest major (large, scheduled-service) airport and straight-line distance
- U.S. Census cartographic boundary files — Matching each city to its county
The PDF layout
Every report can be printed, saved as a PDF or emailed to your sign-in address. Each city starts on its own page:
- Page 1Cover & personality write-up
- Page 2AI home vision
- Page 3#1 Raleigh, NC
- Page 4#2 Charleston, SC
- Page 5#3 Atlanta, GA
- Page 6Crime ranking & regional trends
- Page 7Data sources
- Page 8Appendix: questionnaire answers